MENA Water Trade

The management of MENA local water resources depends on the global water trade. International trade consists of a virtual transfer of water resources from the production country of a good to the consumption one. It is a non-obvious and invisible concept that the graph below tries to clarify.

How is virtual water traffic managed, and how does it differ in MENA?

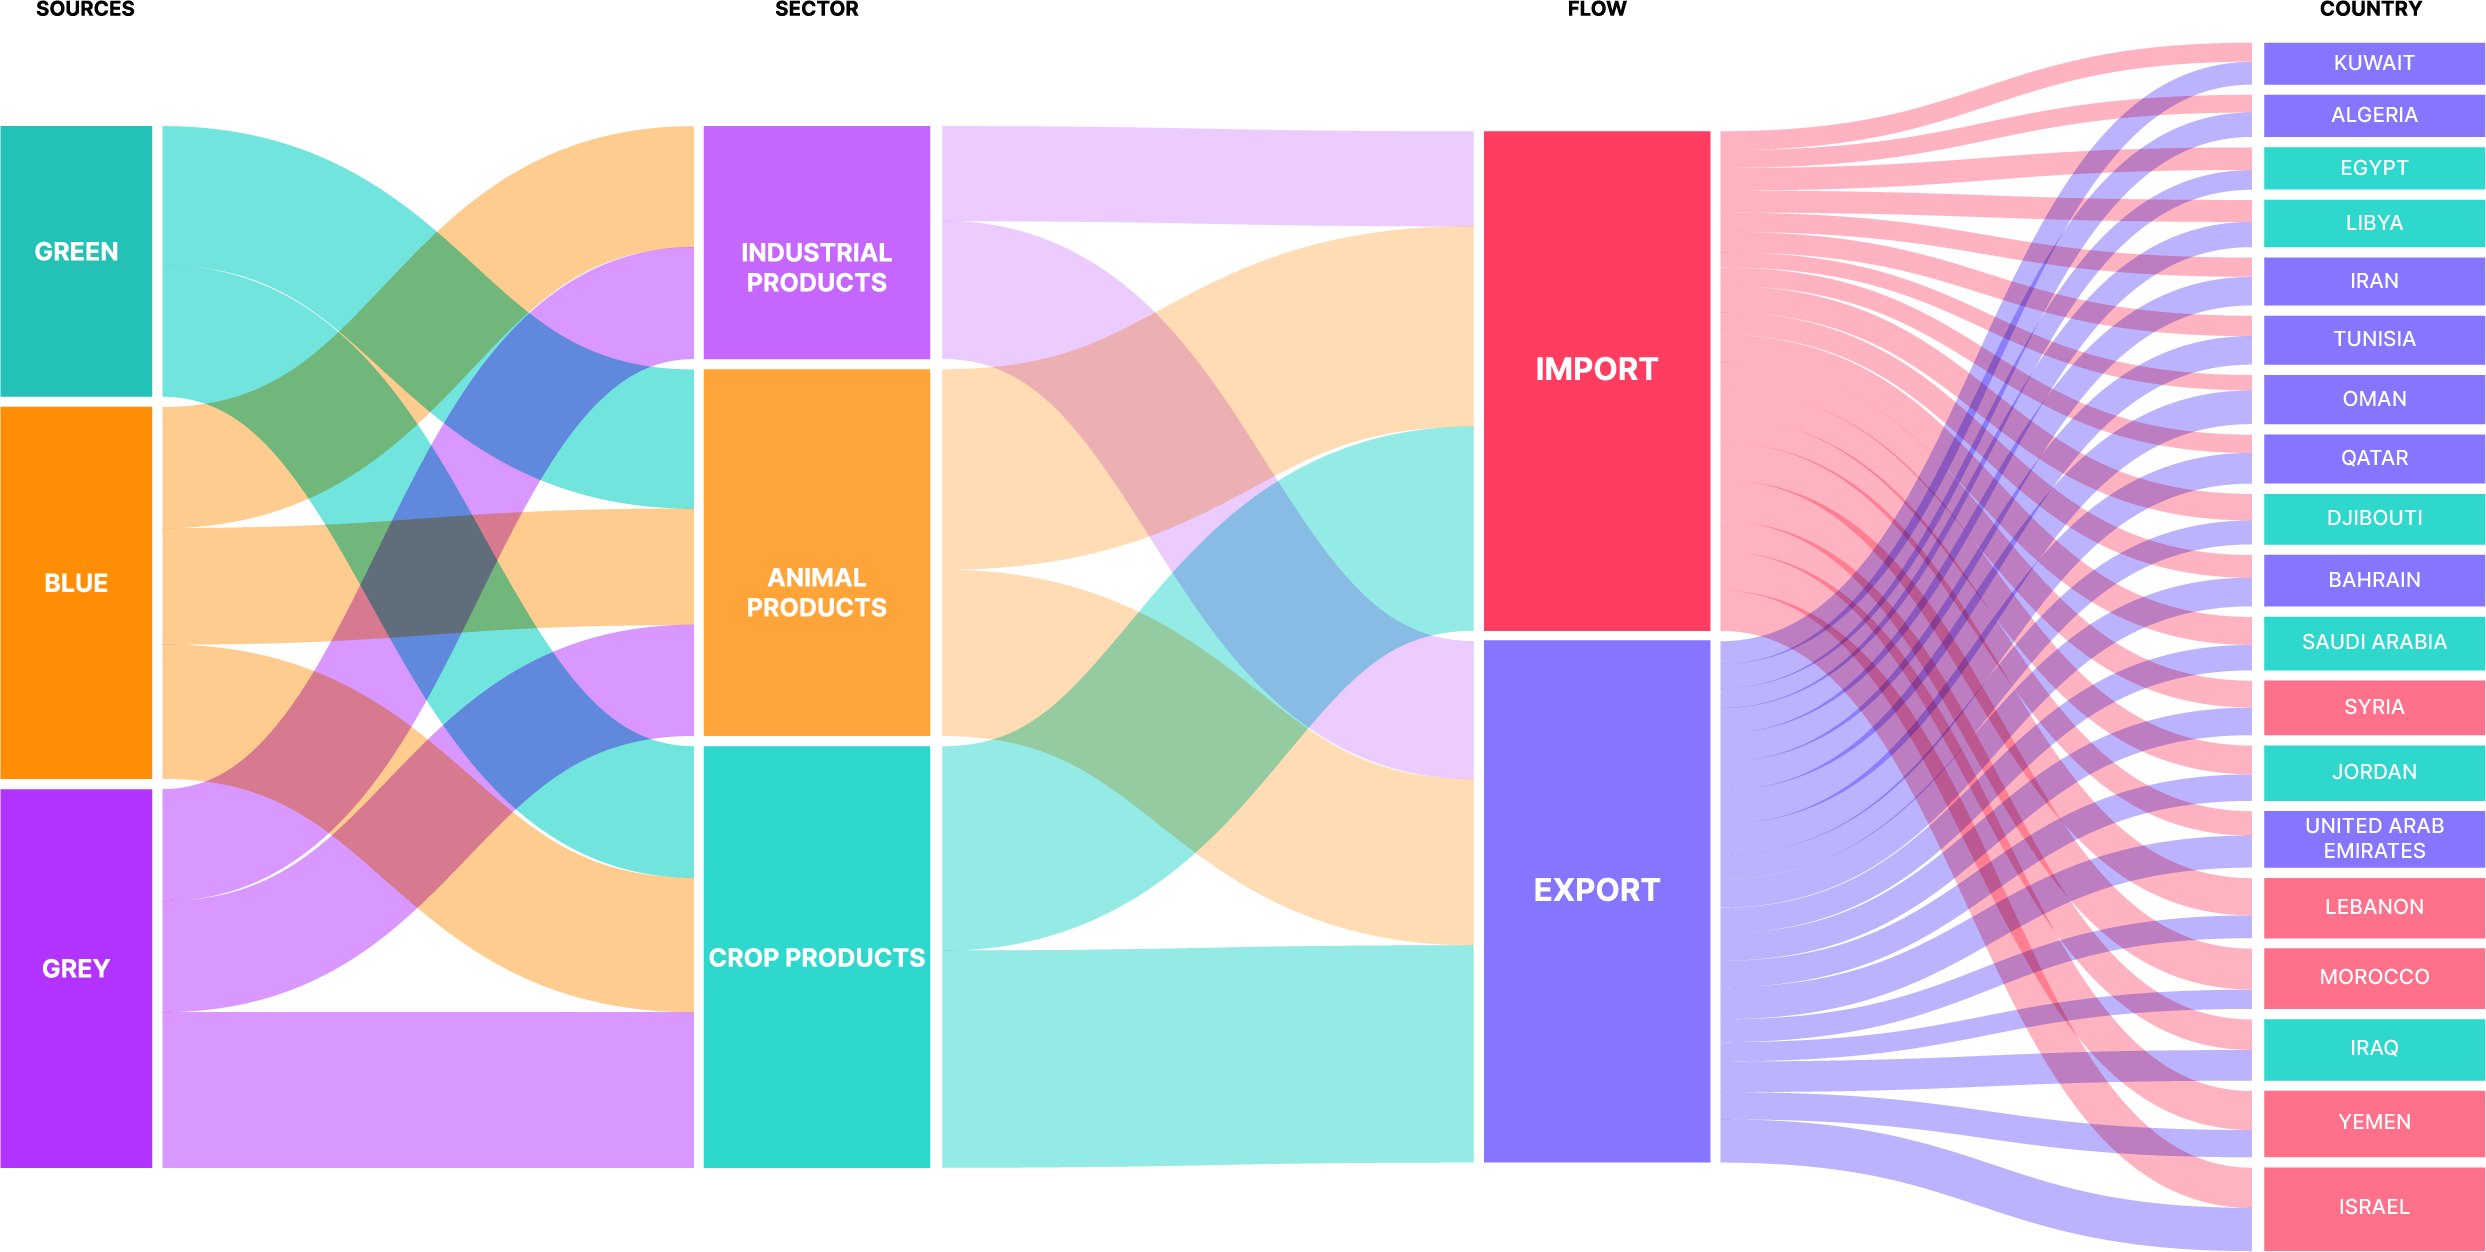
Blue, grey and green water trade by sectors (Source: KAPSARC, dataset retrieved in 2015)

FINDINGS

The alluvial graph shows the global flow of virtual water imports and exports of the 19 MENA countries, most of which are virtual water exporters. Based on the amount of import-export flows converging in a country, we have identified three clusters:

MAJOR IMPORTERS
Kuwait Algeria Iran Tunisia Oman Qatar United Arabian Emirates
BALANCED
Egypt Libya Djibouti Bahrain Saudi Arabia Jordan Iraq
MAJOR EXPORTERS
Syria Lebanon Morocco Yemen Israel
How does the MENA virtual water trade change in different sectors?

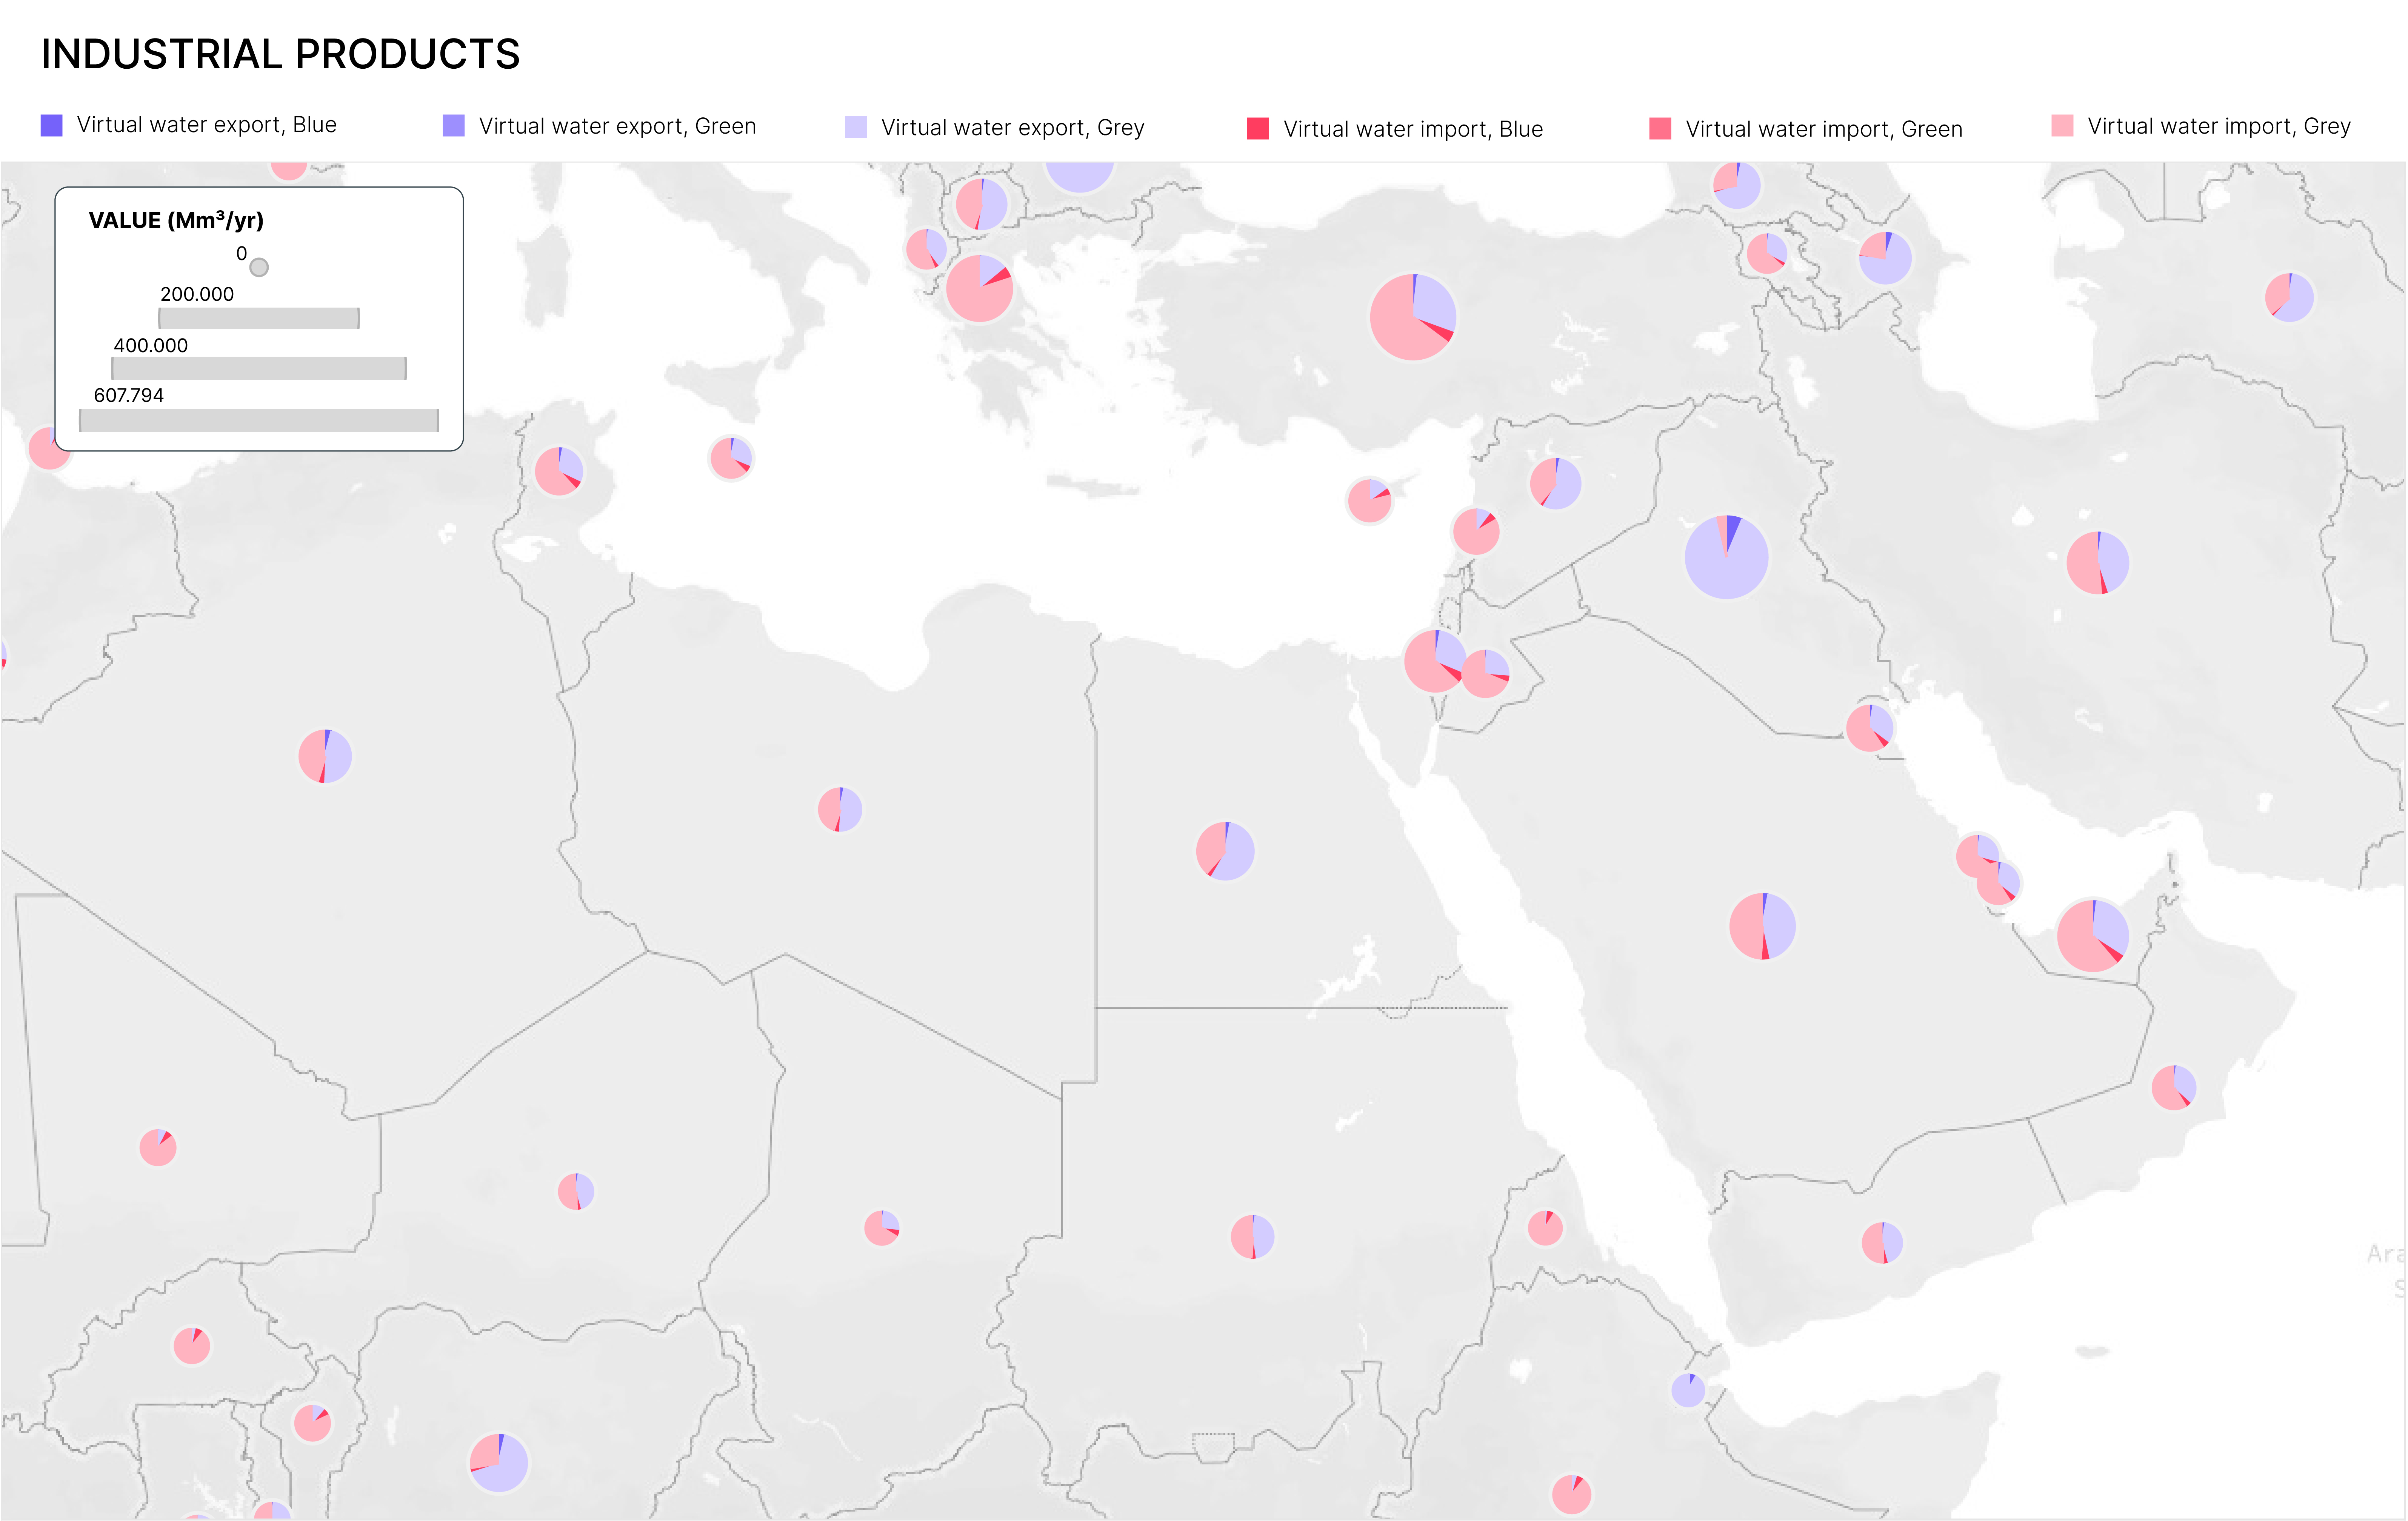
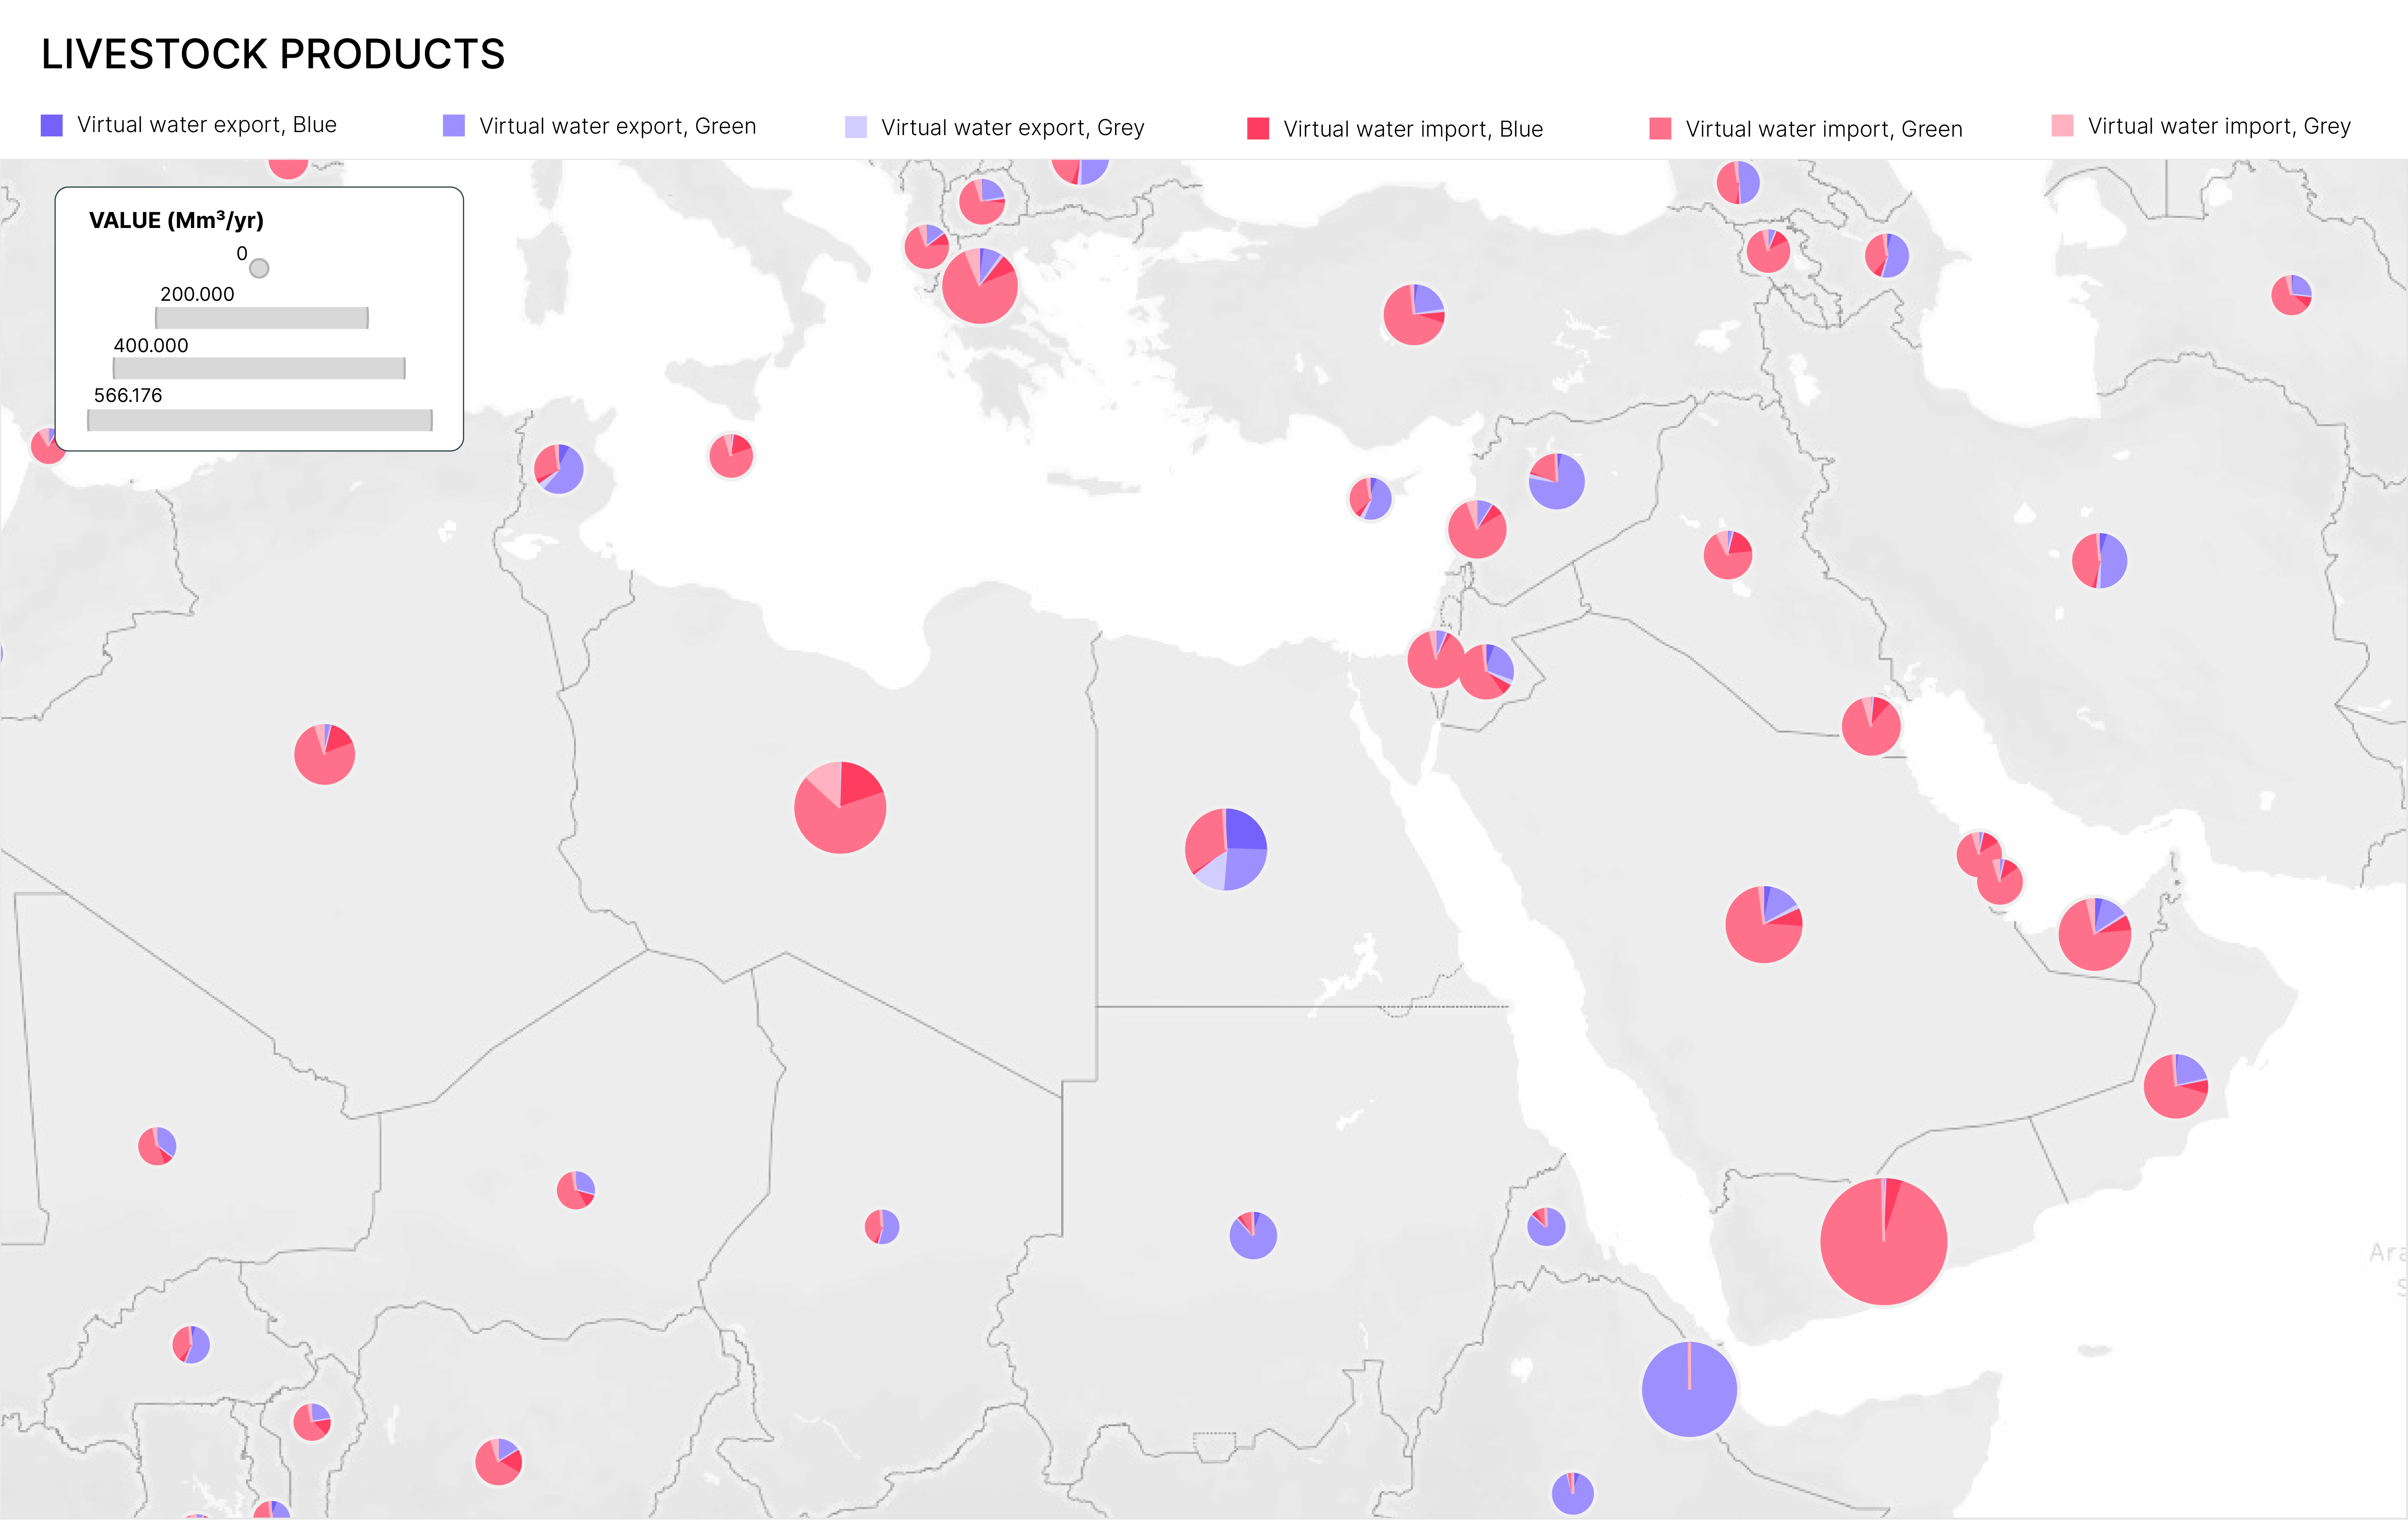
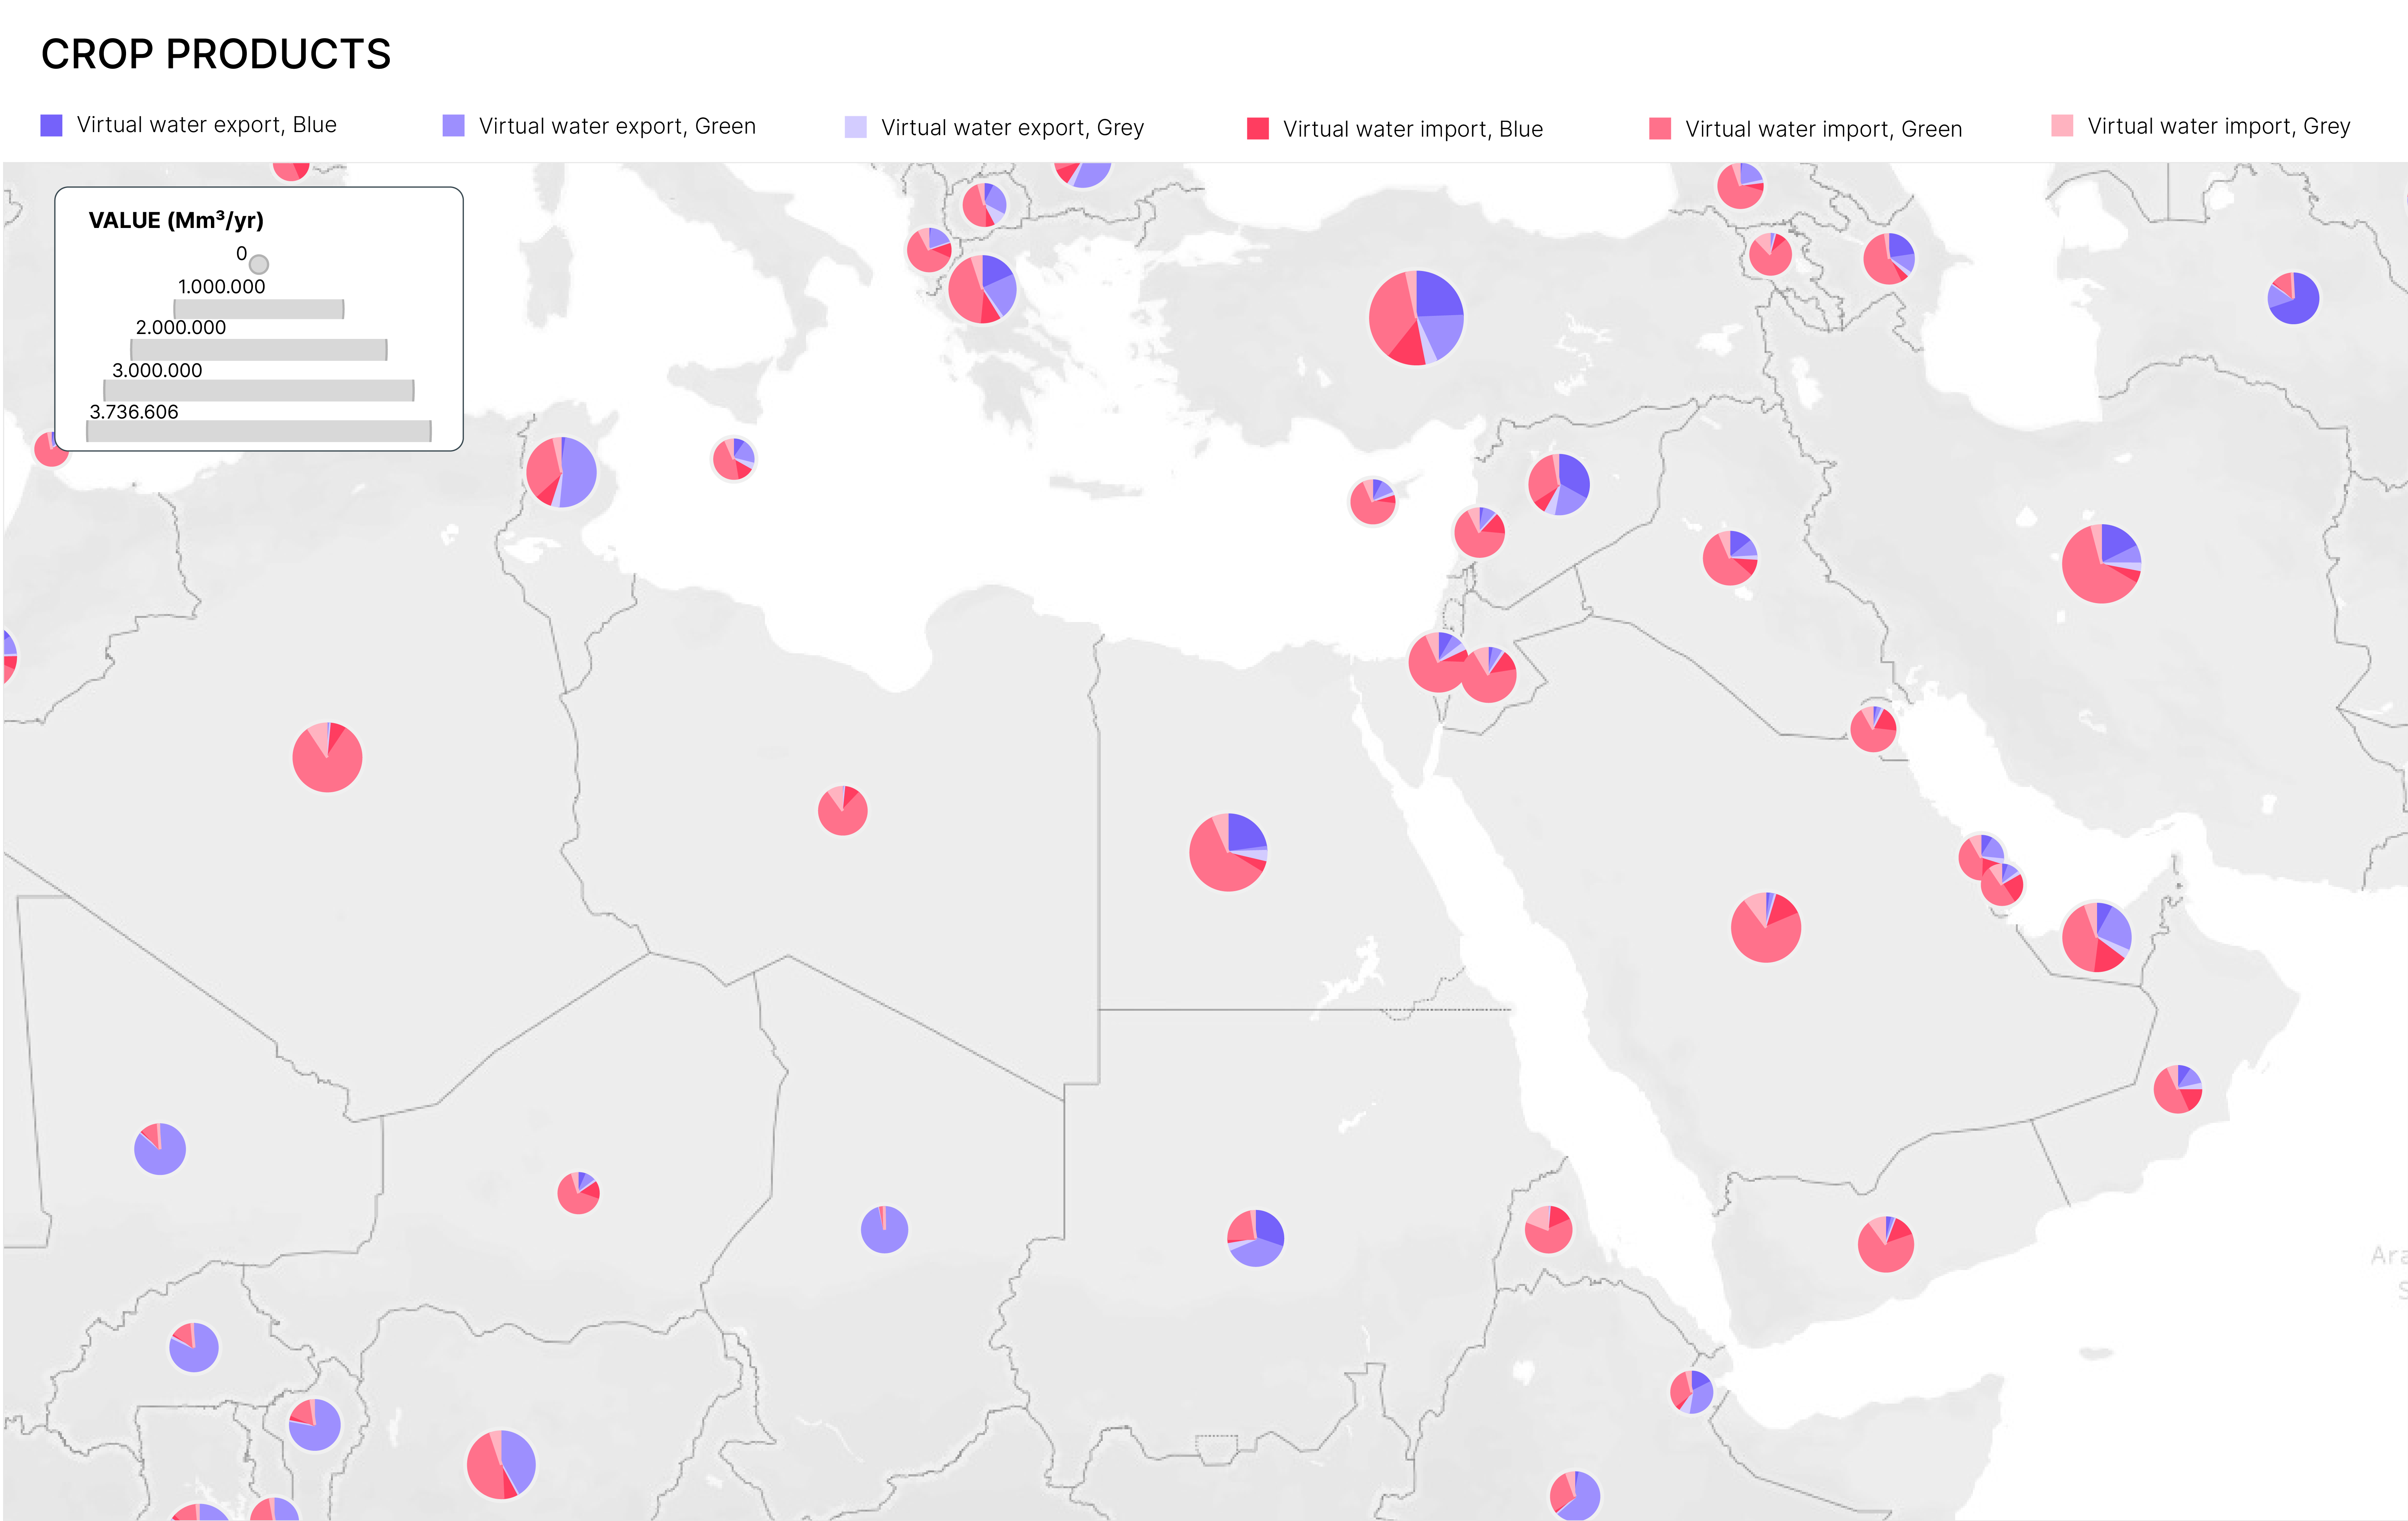
Blue, grey and green water trade by sectors (Source: KAPSARC, dataset retrieved in 2015)

The maps display the virtual water quantity of the MENA trade, translated as the sum of the mm3/yr value of green, blue and grey resources. What emerges is higher expenses related to the agricultural sector.

On the other hand, the pie charts show a significant amount of virtual water imports in the countries to the east, particularly in the crop sector.

The Gulf countries - especially Saudi Arabia and the United Arab Emirates - record the highest amounts of imported green water. However, the UEA is the country with the highest level of green water exports.

The analysis shows that, despite the high water stress in the MENA region, many of its countries are virtual water exporters of agricultural products. The question arises: how do they manage local water resources?

-> MENA local water resources management